
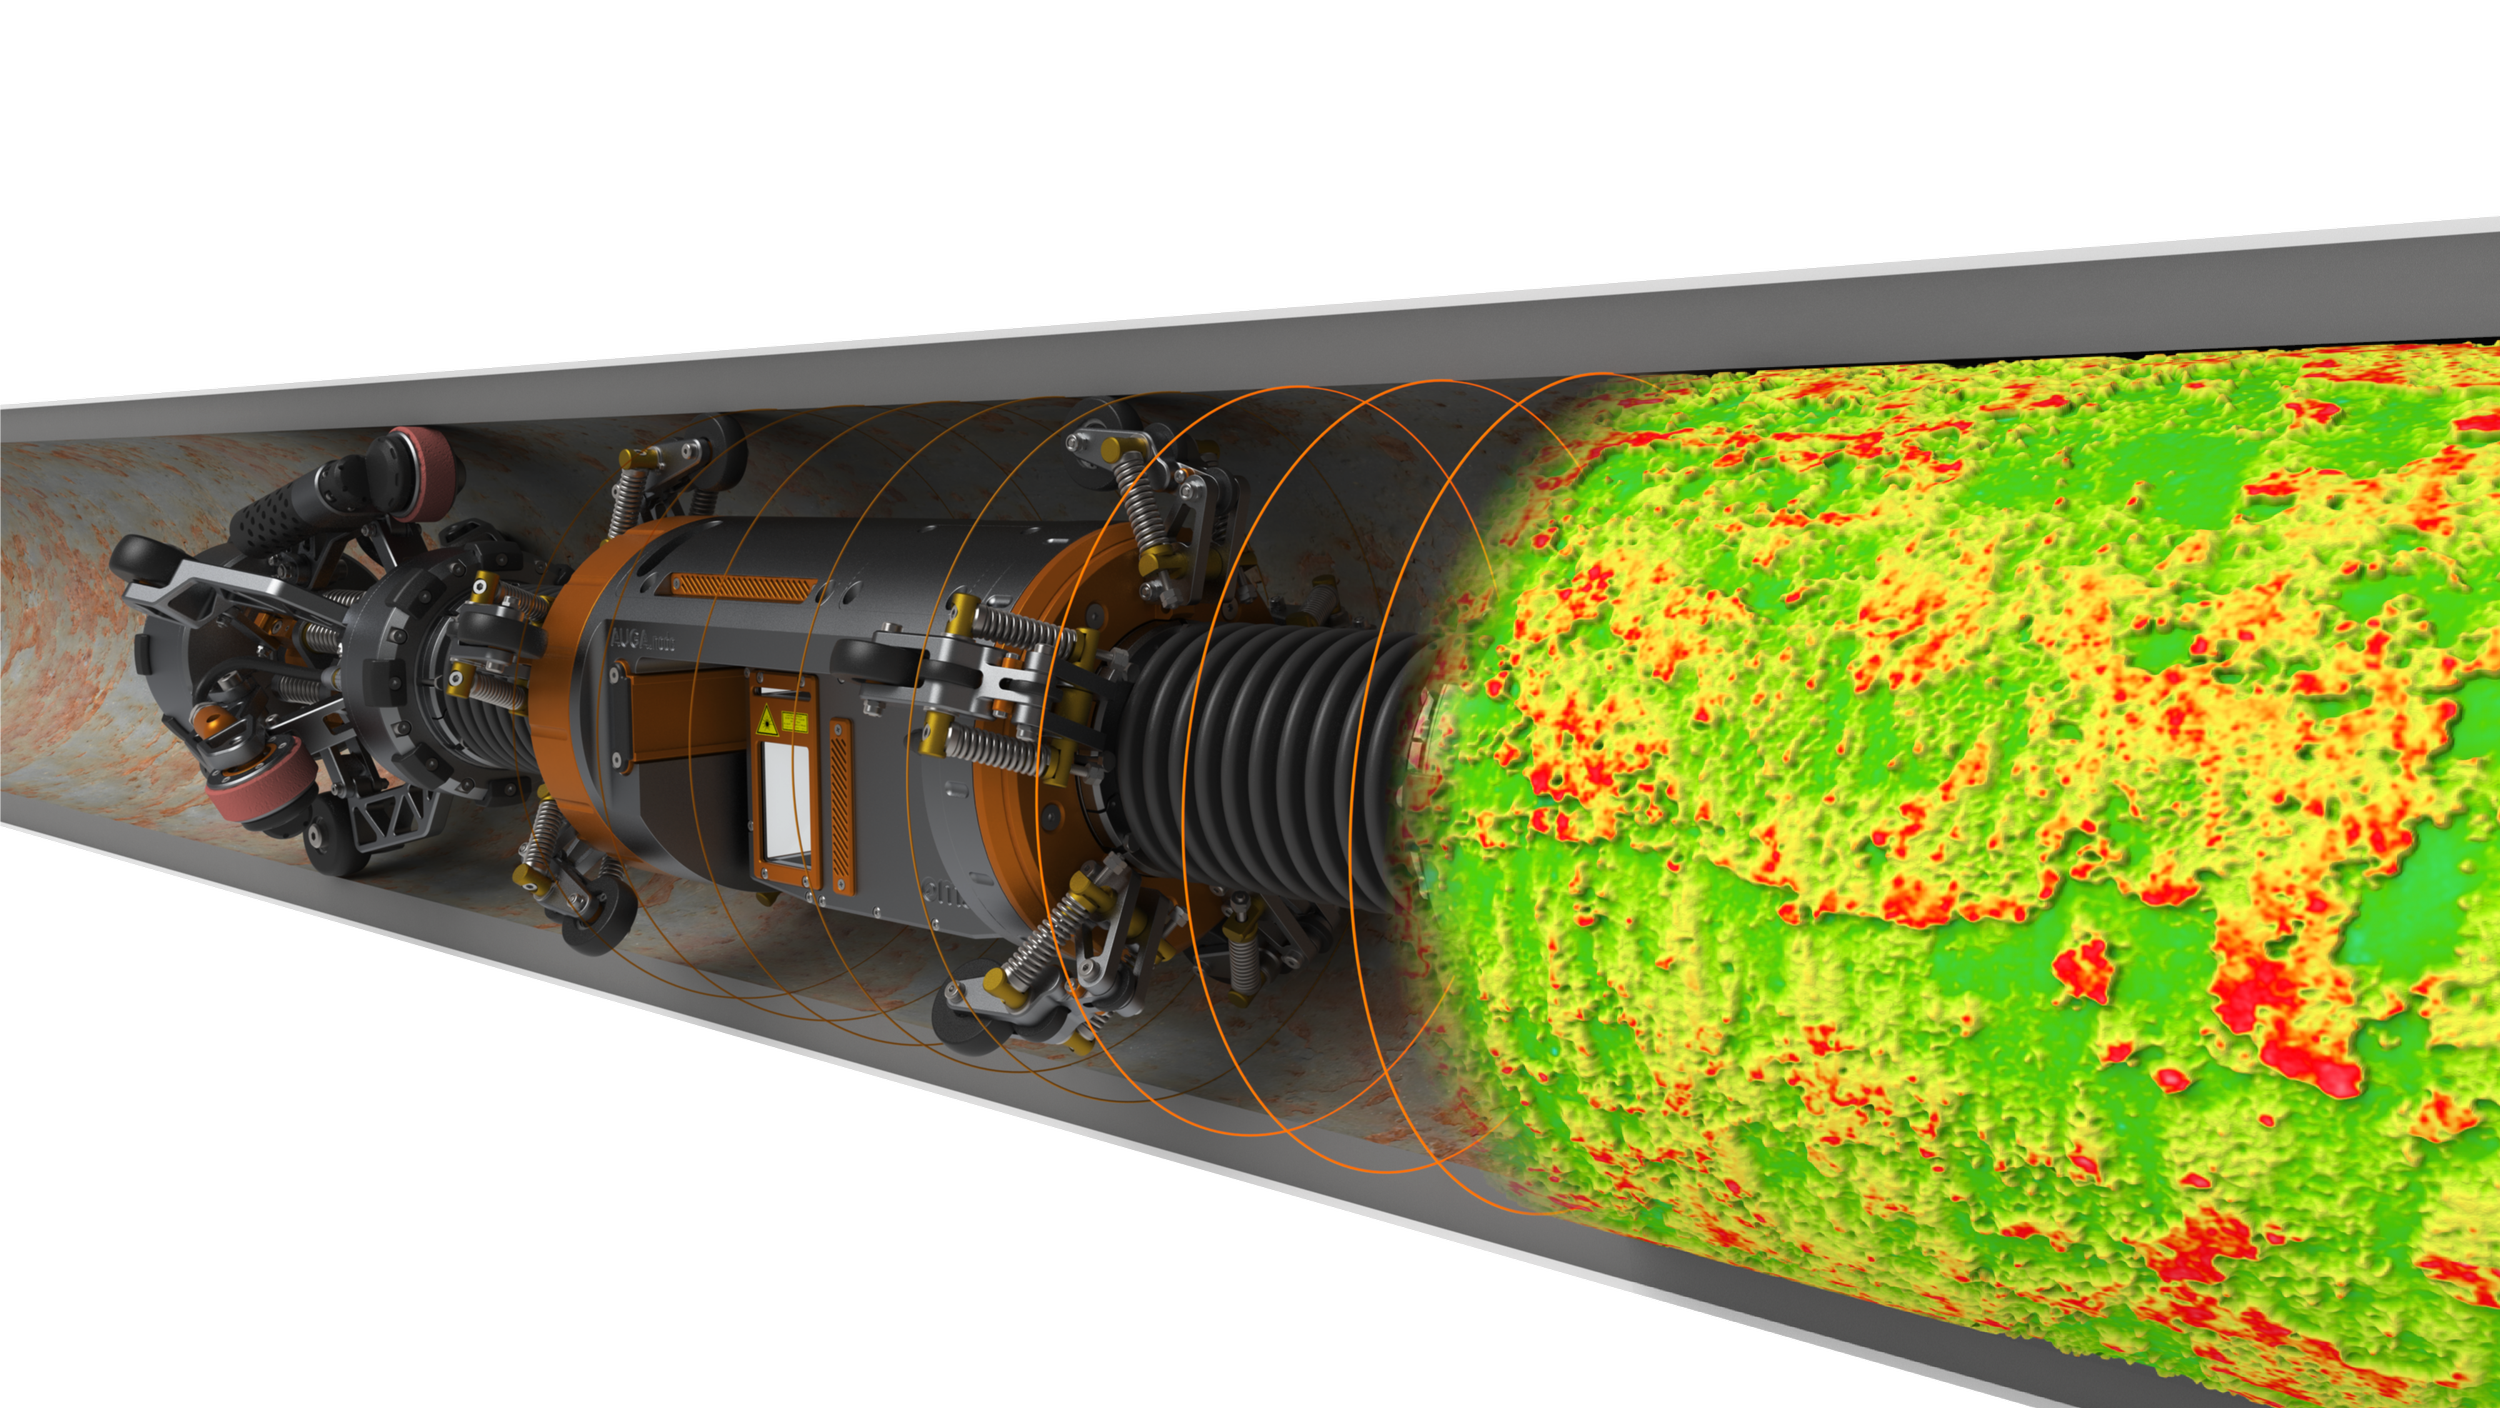
AUGA.node
Award-winning internal visual and laser testing equipment
Available configurations
Attached to the ILUC at welding station 1 or 2, scanning after root and hot pass

Attached to the internal FJC trolley

Deployment: AGILITY crawlers
Pipe ID from 125mm - 1,200mm
Capable of minimum 1.5D elbows
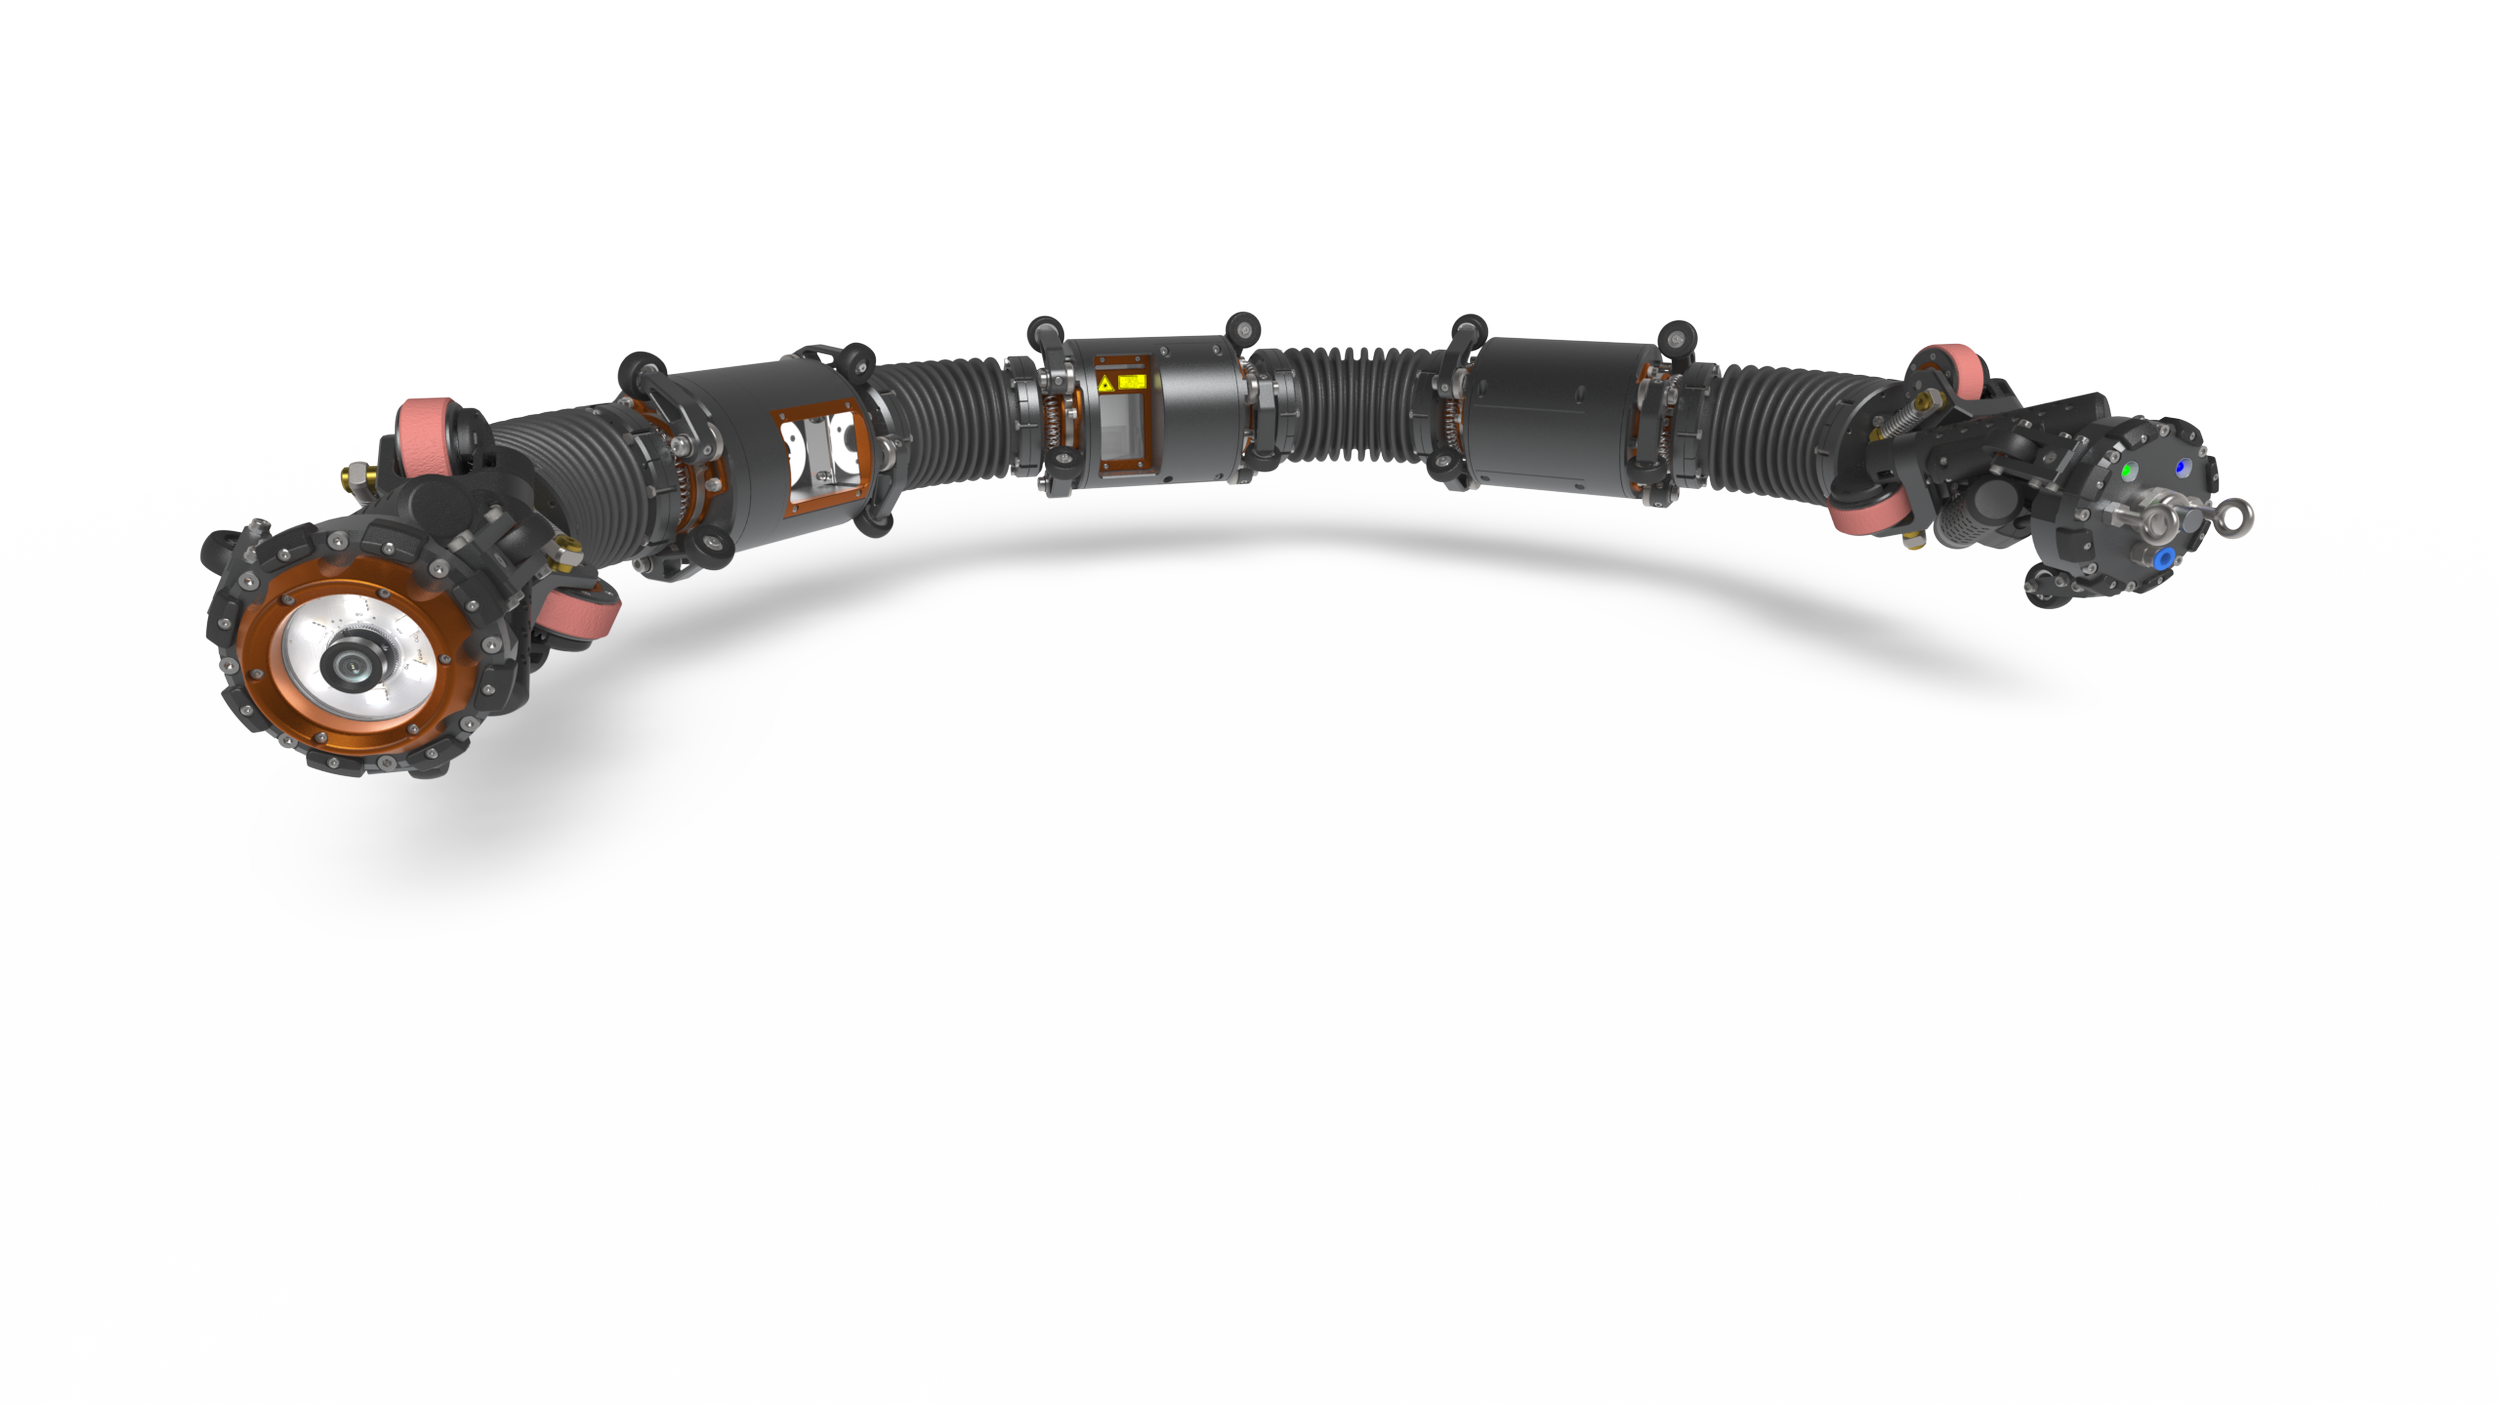
AGILITY.micro
125 - 200mm

AGILITY.mini
200 - 400mm

AGILITY.max
400 - 1,200mm
Compatible with SmartGrind remediation


Features and benefits

Rapid material removal
ID measurement using proven OMS software to verify no WT loss
Weld shaping for improved capability
Laser provides quantitative weld information
Targeted, localised grinding
Pre- and post-laser scanning
Allows welding to proceed with maximum efficiency


Technical specification

Communication, steering and control mode

Communication and hardware control is via Ethernet communication or wifi, in the case of long-range deployment.
Hardware control via proprietary OMS collection software with Xbox style controller to perform manual operations such as head rotation.
Data acquisition and co-ordinate frame of reference
Scan data collected via automated triggering of camera and laser at predefined intervals based off angular resolution requested. Options for laser scans as follows:
2,048 scans per 360-degrees
1,024 scans per 360-degrees
512 scans per 360-degrees

72 images collected automatically with full overlap between images to ensure no missing regions
File name is entered by the user and saved in the project directory
Coordinate frame of reference options (i.e., ZERO degrees for camera and laser data) options:
Top-dead-centre (based off gravity)
Bottom-dead-centre (based off gravity)
Visual point of interest (using live camera image)
Control software live view
Laser calibration and verification


Live feed of the laser data as well as either the side (weld camera) images or the front camera images. Note that the front camera may not be present in some configurations.
Lighting can be enabled/disabled in the software. The image brightness can be adjusted by reducing or increasing the camera exposure time via the control software.
The current head angle is also shown in the live view.
All lasers are supplied with calibration certificates traceable to UKAS and International Standards.
On-site verification of the laser is carried out using calibrated ceramic step gauges.
System validation

Typical project validation involves scanning project welds during the welder qualification stage and logging of scans and defects into a project defect library. In instances where the quantitative laser values need to be validated the weld is typically macro sectioned and the results compared to the IVLT results. In some instances, repeatability testing is carried out whereby the same weld is scanning multiple times (i.e. ten (10) times) and the deviation across these ten (10) scans analysed.
NOTE: We have successfully conducted several of these validation campaigns for customers and it is not always stipulated within the contract. Typically it is only required for new customers or for particularly high-profile projects.
Scan review
Full-resolution data is viewable after the scan within the WeldAnalysis software. At this stage there will also be more viewing options available to visualise the data. They are represented by icons on the left menu. The user will see two (2) views at a time and can change which the current views are at any point. Left-click on the selected icon to use this view on the left side, and right-click on another icon to use on the right of the screen. If a view is already in use on the other side the two (2) views will switch places. The four (4) views available, left to right are:
Graph view: This view represents the current profile on a graph and quantifies the scale of the profile. Use the bottom scrollbar or arrow keys to browse the profiles
3D middle view: This will represent an area of the weld as a 3D topographical map viewed from above and at an angle. This gives an idea of the shape of the weld
Photo view: This view displays the photo collected closest to the current position. The photo will update as the user scrolls around weld
Image view: This view represents using a scale of shade of blue. Here the weld is usually visible, along with darker areas of concavity, lighter areas where high root penetration exists, and contrast between left and right indicating greater HiLo
Re-entrant angle is available to view within the WeldAnalysis user interface. This is a useful parameter when steepness of the weld is of interest.


Review results
Before generating the report, the user can use multiple views, alongside plots of measurement statistics to carry out a closer inspection of any features, and record comments before the report is created. The icons on the bottom left side of the screen which appear allow the user to view the analysis of the inspection category. Hover over each icon in the left menu for a description of what each is. The graphs will display the tolerances/bands set in settings, marked on the graphs as lines and outlined underneath under the heading Statistics. Under Statistics, it will also detail the max. and min. values and their corresponding angle.

Views available:
Graph view
3D view
Photo view
View comments
Review:
HiLo (min., max., avg.)
HiLo average
Weld width
Concavity/negative root indications
Left/right re-entrant angle
Min/max root penetration (min., max., avg., left, right)
Left/right root penetration
Left/right indications of undercut
Report generation
Each Excel report has an overview as a front sheet incorporates all the information populated in WeldAnalysis. It also summarises the selected measurement statistics and uses traffic light colour indicators to signify compliance with the chosen tolerance levels. The next sheet, ‘Weld Profiles’ is a dynamic sheet in which the user can navigate through both laser data and corresponding camera images using the scroll bar. All laser and camera data is supplied within the Excel reports. The other available sheets will report on each statistic chosen from the ‘Select Report(s)’ list at the report generation phase of weld analysis. They include graphs and data based on the findings based on tolerance levels. Sample Excel reports can be provided upon request.
Some customers require the categories/tabs in the excel report to have specific names. This can be changed and can be done so by speaking to OMS.
If a custom report layout is required for a project, this can be created but will require a custom template created specifically for a project.